

Week In Perspective | Election Whiplash: Rally Fades Into the Worst Day Since April 09-November-26
Key Takeaways
- Stocks reversed a midterm rally last week: the S&P 500 had its worst day since April 2025, and the Nasdaq slipped into a correction.
- For the week, the S&P 500 fell 2.68%, the Nasdaq Composite 3.37% and the Dow 0.94%; the Nasdaq has now declined four weeks in a row.
- AI-related stocks fell more than the broader market since early September, according to Macro Roundup's analysis of Michael Cembalest's AI universe.
- October payrolls rose by 165,000, well above forecasts of about 65,000, and the unemployment rate edged down to 4.1%.
- The Federal Reserve held rates at 3.75% to 4.00% in a 10–2 vote with two dissents favoring a hike, and markets price a quarter-point increase in December.
- This week brings October inflation data on Tuesday and Cisco earnings on Thursday; U.S. stock markets are open on Veterans Day.
The Roller Coaster Week on Wall Street
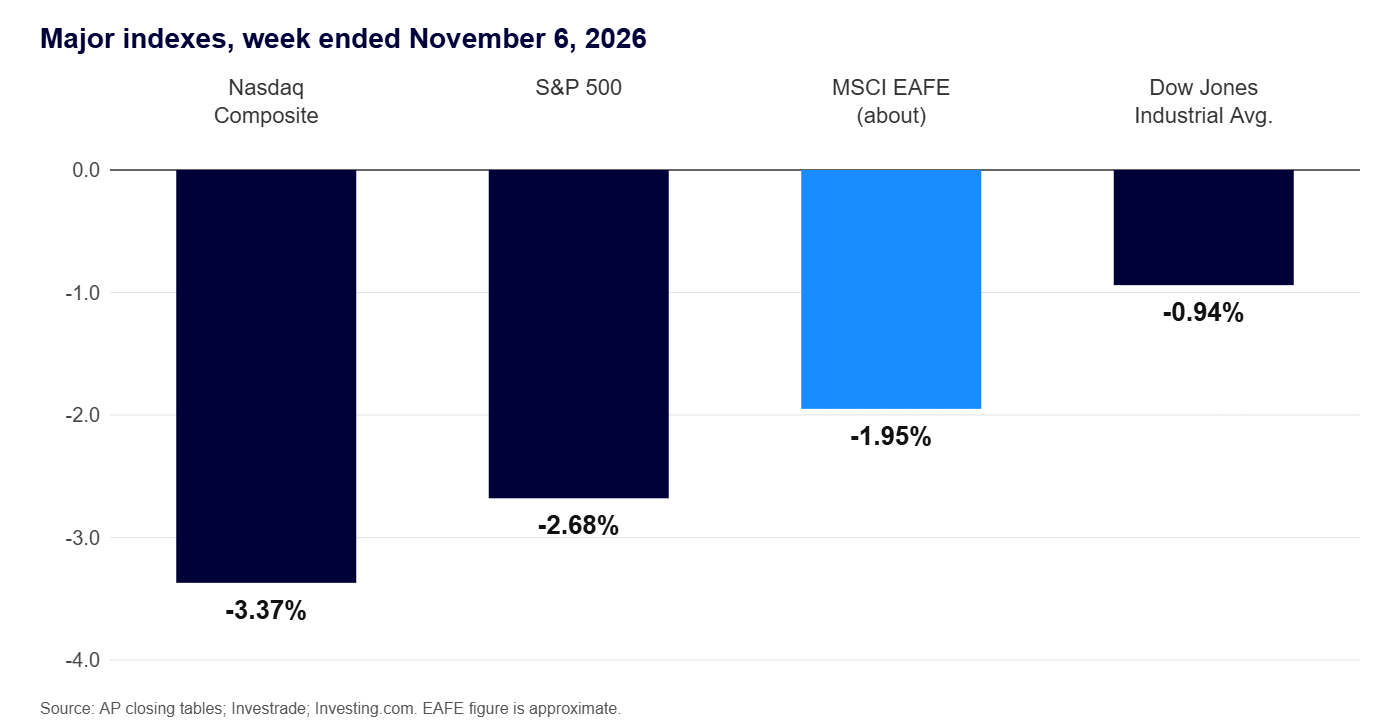
A midterm-election rally gave way to the worst day for U.S. stocks since April 2025, and the major averages finished the week lower. The Standard & Poor's 500 Index fell 2.68%, its worst week since April 2025, the Nasdaq Composite Index dropped 3.37%, and the Dow Jones Industrial Average lost 0.94%.1,2 The MSCI EAFE Index, which tracks developed overseas markets, fell about 1.95%.3 It was the Nasdaq's fourth straight weekly decline.4
| Index | Weekly Change |
|---|---|
| S&P 500 | -2.68% |
| Nasdaq Composite | -3.37% |
| Dow Jones Industrial Average | -0.94% |
| MSCI EAFE (developed overseas) | -1.95% |
Midterm Election Whiplash
Stocks started the week unevenly on Monday as Brent crude fell more than 7% on hopes for U.S.-Iran talks. Technology shares slipped, the Nasdaq and S&P 500 closed lower, and the Dow edged up.5,6
Election Day on Tuesday ended mixed, with the Dow lower and the S&P 500 and Nasdaq higher as chip stocks and cloud-infrastructure shares rebounded from Monday's sharp losses.7,8 Apple shares fell after its quarterly results disappointed on China revenue.8 Trading was subdued ahead of the results, and reports showed September job openings rose to a four-month high while factory orders increased more than expected.8
On Wednesday, stocks surged after Democrats won control of Congress. The Dow jumped more than 1,500 points, the S&P 500 had its best day in three months, and oil fell about 8%.9 Investors welcomed the end of election uncertainty, and large cloud-computing companies advanced even as the Democratic sweep raised concern about new limits on data-center construction.10
The rally reversed on Thursday. The S&P 500 fell 4.36%, its worst day since April 2025. The Nasdaq Composite dropped 5.52% and entered correction territory, the Dow Jones Industrial Average lost 1,833 points, and the Russell 2000 Index, which tracks smaller companies, fell about 4.4%, as investors worried that a Democratic Congress could restrict AI data-center construction. All 11 S&P 500 sectors finished lower, led by technology.11,12,35
Friday brought a partial rebound as AI and chip stocks recovered. The Nasdaq and S&P 500 gained, while the Dow slipped as Treasury yields rose after the jobs report.1,13
Why Last Week Was a Turning Point
Through much of the fall, enthusiasm for artificial intelligence spending helped carry U.S. stocks to records, and the Nasdaq Composite posted its record close on October 6. Last week tested that story. After Democrats won big in the midterm elections, including in states central to data-center construction, investors worried about tougher scrutiny or possible moratoriums on new data centers. By Thursday's close the Nasdaq Composite was about 12% below its record, a decline of 10% or more from a recent peak that Wall Street calls a correction, and the so-called Magnificent Seven stocks had lost more than $1 trillion in market value in a single session.28,29
Policy was only part of the picture. Earnings from large technology companies in October had not fully reassured investors about the returns on AI spending, and the selloff brought those questions together with the election news.27
The Week in Charts
All four benchmarks fell for the week, with the Nasdaq Composite posting the steepest decline and the Dow Jones Industrial Average the smallest.1,2,3
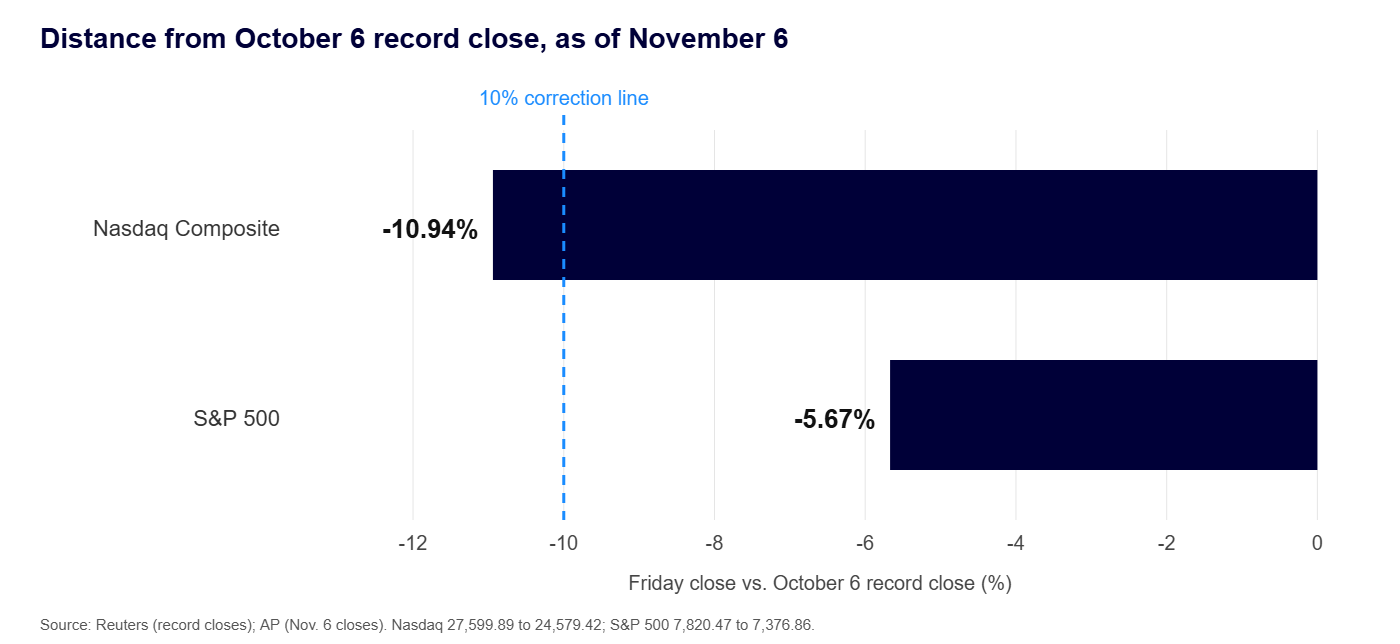
Measured from their October 6 record closes, the Nasdaq Composite finished Friday 10.94% lower and the S&P 500 5.67% lower. A decline of 10% or more from a recent record close is commonly defined as a correction.27,32,33
On the technical side, the Nasdaq Composite and the Nasdaq-100 Index closed Friday below their 10-day, 20-day, 50-day and 200-day moving averages, which track the short-term, intermediate-term and long-term trends. The S&P 500 closed below its 10-day, 20-day and 50-day moving averages but remained above its 200-day moving average, at 7,376.86 against about 7,325.34
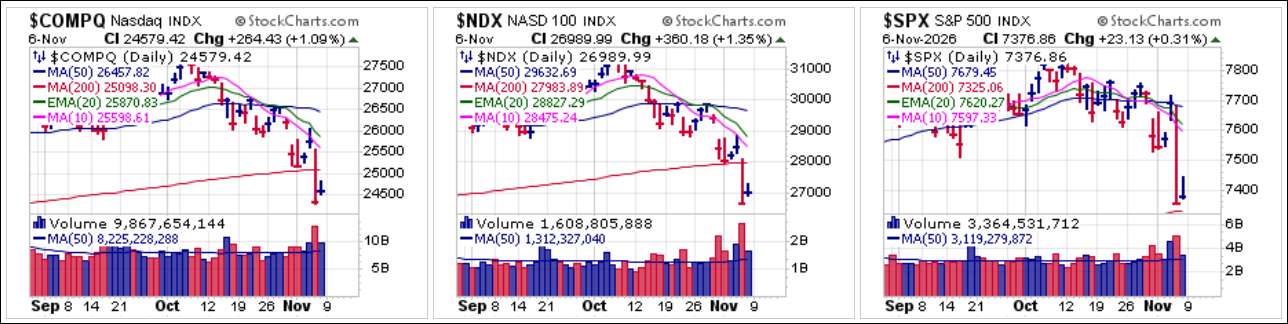
Daily charts of the Nasdaq Composite, Nasdaq-100 and S&P 500 with moving averages, through November 6, 2026. Chart source: StockCharts.com.
Technology and AI-related stocks accounted for a large share of the S&P 500's decline since early September. A 42-stock AI universe defined by J.P. Morgan Asset Management's Michael Cembalest fell about 8.9% from Sept. 4 through Nov. 5, compared with about 4.7% for the S&P 500 and about 1.1% for the rest of the index, according to Macro Roundup.36,37
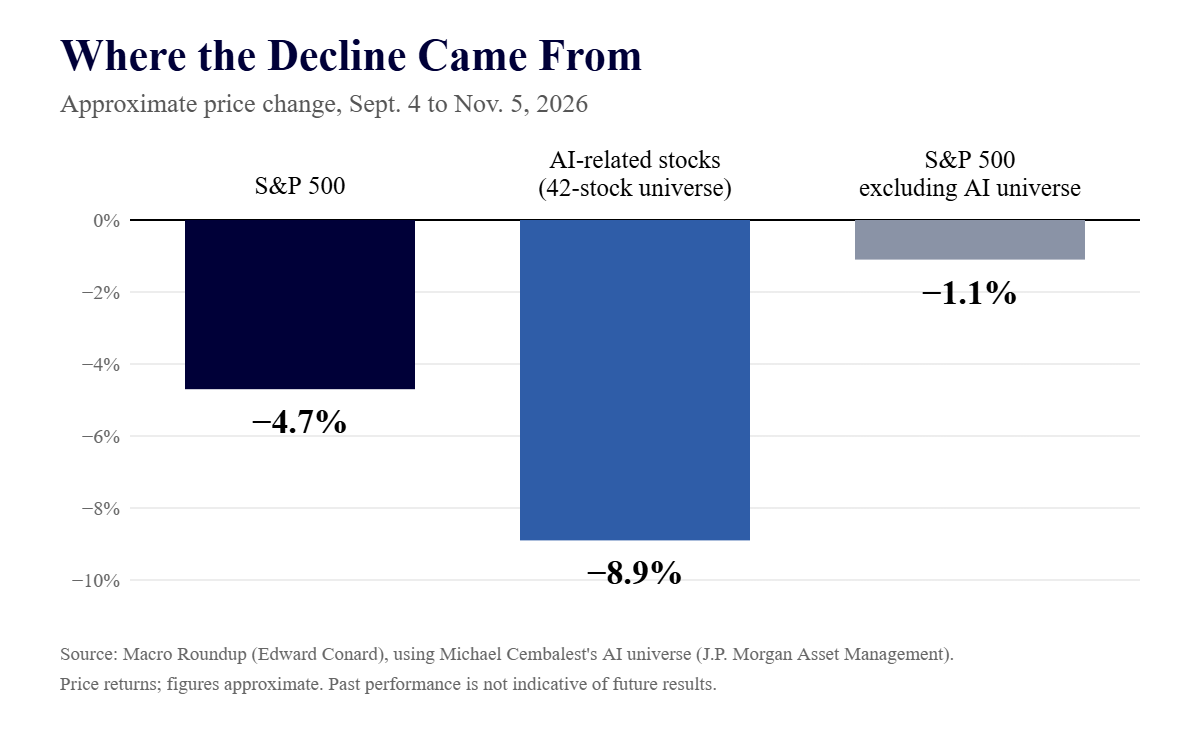
AI-related stocks versus the rest of the S&P 500, Sept. 4 to Nov. 5, 2026. Source: Macro Roundup, using Michael Cembalest's AI universe. Figures approximate.
Jobs Surprise, Rate Hike Watch
Employers added 165,000 jobs in October, well above forecasts of about 65,000, and the unemployment rate edged down to 4.1%. Average hourly earnings rose 0.4%, and upward revisions added 84,000 jobs to August and September.12,14
The Federal Reserve held its benchmark rate at 3.75% to 4.00% on October 28 in a 10–2 vote, with Governor Lisa Cook and Cleveland Fed President Beth Hammack dissenting in favor of a quarter-point increase.15,16 Markets continue to price in a quarter-point increase at the Fed's December 8–9 meeting.17 Taken with the AI selloff, a stronger labor market and a Fed leaning toward another increase leave investors weighing slower AI-related spending and higher borrowing costs at the same time.15,16,17
What to Watch This Week
The October Consumer Price Index arrives Tuesday at 8:30 a.m. Eastern. Forecasters broadly expect core prices, which exclude food and energy, to rise a modest 0.2% for the month.30,31 A reading at or below that pace could ease some pressure on the Fed, while a hotter one could strengthen the case for a December increase. Cisco's results on Thursday will also offer a read on technology demand, and the November jobs report on December 4 is the last employment data before the Fed meets.14 These are market expectations, not a forecast of what will happen.
THIS WEEK: KEY ECONOMIC DATA
Monday: Federal Reserve speakers.
Tuesday: Consumer Price Index (October). Federal Reserve speakers.
Wednesday: Veterans Day. U.S. stock markets open. Bond markets closed.
Thursday: Initial Jobless Claims. Existing Home Sales (October). Federal Reserve speakers.
Friday: Producer Price Index (October). Federal Reserve speakers.
Source: Simianx; Trading Economics; FinancialJuice; Finviz; TheStreet; Federal Reserve Board. The forecasts or forward-looking statements are based on assumptions and may not materialize.18,19,20,21,22
This Week: Major Companies Reporting Earnings
Monday: Take-Two Interactive (TTWO), Skydance (SKYD), Occidental Petroleum (OXY), The Trade Desk (TTD), Hims & Hers Health (HIMS), KKR (KKR).
Tuesday: TransDigm Group (TDG), Sea Limited (SE), On Holding (ONON), CoreWeave (CRWV).
Wednesday: No major U.S. companies are scheduled to report.
Thursday: Cisco Systems (CSCO), Applied Materials (AMAT), Nebius Group (NBIS), Brookfield Corporation (BN).
Friday: No major U.S. companies are scheduled to report.
Source: StockTitan/Nasdaq; Cisco Investor Relations; Skydance Corporation; Digrin. Companies mentioned are for informational purposes only. Companies may reschedule their earnings reports without notice.23,24,25,26
A Note on Staying Disciplined
Corrections like this are uncomfortable, and they are a normal part of investing. A sharp week does not change your goals, time horizon, or the cash you have set aside for near-term needs, and those are what your plan is built around. If last week raised questions about your own situation, please reach out and we will walk through it together.
Questions about your own plan? Contact our team to schedule a conversation, or explore our free retirement and financial planning guides.
TCM Wealth Advisors | Akron/Canton & Cleveland Fee-Only Fiduciary Financial Advisor
Since 2004, TCM Wealth Advisors has delivered comprehensive, fee-only fiduciary financial guidance to individuals, families, and business owners across Northeast Ohio—including the greater Akron/Canton and Cleveland areas—as well as serving clients nationwide. Our independent, client-first approach ensures that every recommendation is made in your best interest.
As a fully independent advisory firm held to the highest fiduciary standard, we are legally and ethically bound to act solely in your best interest. Our fee-only compensation model eliminates the conflicts of interest inherent in commission-based structures, allowing us to deliver objective, personalized advice tailored to your specific goals and financial circumstances.
Whether you're building wealth, preparing for retirement, planning business succession, or navigating complex financial decisions, TCM Wealth Advisors leverages four decades of financial and investment planning experience to deliver strategic, goal-based solutions to help you achieve long-term financial success.
To begin your journey toward a confident, stress-free financial future with a fee-only fiduciary financial advisor, call 330-836-7000 to schedule an introductory conversation. You may also book a meeting with our team here.
Ready to take the next step?
Let's start with a conversation. We'll assess your current portfolio, discuss your goals and timeline, and evaluate your tolerance for risk and volatility — all at no cost to you. Call us at 330-836-7000 to schedule your complimentary portfolio review and risk assessment.
Sources:
- Yahoo Finance (au.finance.yahoo.com)
- Stock Market Watch (stockmarketwatch.com)
- MSCI (msci.com)
- YourNews (yournews.com)
- Zacks (zacks.com)
- Anadolu Agency (aa.com.tr)
- Stock Market Watch (stockmarketwatch.com)
- Nasdaq.com (nasdaq.com)
- Stock Titan (stocktitan.net)
- CME Group (cmegroup.com)
- Stock Titan (stocktitan.net)
- Charles Schwab (schwab.com)
- Fox Business (foxbusiness.com)
- U.S. Bureau of Labor Statistics (bls.gov)
- WealthManagement.com (wealthmanagement.com)
- investingLive (investinglive.com)
- InvestmentNews (investmentnews.com)
- FinancialJuice (features.financialjuice.com)
- TheStreet (pro.thestreet.com)
- Finviz Economic Calendar (finviz.com)
- U.S. Bureau of Labor Statistics (bls.gov)
- Federal Reserve (federalreserve.gov)
- Stock Titan (stocktitan.net)
- Cisco Newsroom (newsroom.cisco.com)
- Finviz (finviz.com)
- Digrin (digrin.com)
- Reuters via GV Wire (gvwire.com)
- CNBC (cnbc.com)
- Charles Schwab (schwab.com)
- CNBC (cnbc.com)
- Continuum Economics (continuumeconomics.com)
- Associated Press via La Nacion (lanacion.com.ar)
- Reuters via Virginia Business (virginiabusiness.com)
- StockCharts.com (stockcharts.com)
- Stock Market Watch (stockmarketwatch.com)
- Macro Roundup (edwardconard.com)
- J.P. Morgan Asset Management (am.jpmorgan.com)